Variables
- Diabetes among Adults
- Gestational Diabetes among Pregnant Women
- Hospitalization due to Diabetes (Primary and Comorbidity)
- Hospitalization Charge due to Diabetes (Primary and Comorbidity)
According to the Centers for Disease Control and Prevention (CDC), diabetes is the condition in which the body does not properly process food for use as energy. Most of the food we eat is turned into glucose, or sugar, for our bodies to use for energy. The pancreas, an organ that lies near the stomach, makes a hormone called insulin to help glucose get into the cells of our bodies. When you have diabetes, your body either doesn’t make enough insulin or can’t use its own insulin as well as it should. This causes glucose to build up in your blood.
The two main types of diabetes are type 1 diabetes and type 2 diabetes.[1] Type 1 diabetes, previously called insulin-dependent diabetes mellitus or juvenile onset diabetes, accounts for 5 to 10 percent of all diagnosed cases of diabetes. Autoimmune, genetic, and environmental factors are involved in the development of this type of diabetes.
Type 2 diabetes , previously called non-insulin-dependent diabetes mellitus or adult-onset diabetes, accounts for about 90 to 95 percent of all diagnosed cases of diabetes. Type 2 diabetes, once known as adult-onset diabetes, is now recognized as a growing problem among young adults and youth.[2] Individual risk factors for Type 2 diabetes include obesity, family history of diabetes, prior history of gestational diabetes, gestational diabetes in the mother, low birthweight, impaired glucose tolerance, unhealthy diet especially consumption of sugary foods, and physical inactivity. [3, 4] Living conditions, personal belief systems, and institutional policies and practices contribute to type 2 diabetes by limiting the options for healthy lifestyle choices. For example, overweight and obesity, the biggest predictor of diabetes, is affected by barriers to physical activity (e.g. safety, costs, location of facilities), limited healthy food options (e.g. food insecurity, food deserts, not being breastfed), and poverty. [5]. The social determinants of health, including Physical Activity, Nutrition, and Economic Environment, are discussed in further detail throughout this assessment. Asians, Black/African Americans, Native Americans and Latinos and those with a lower socioeconomic status are more likely to have diagnosed or undiagnosed type 2 diabetes. [6] Contributors to the racial and ethnic disparities seen in type 2 diabetes include inferior neighborhood conditions; biological causes such as differences in glucose metabolism and the development of insulin resistance; behavioral causes including higher, higher smoking rates, and increased consumption of refined sugars, as well as other factors such as higher obesity rates, higher depression rates, increased rates of gestational diabetes, and increased abdominal fat. [7, 8]
Black/African Americans are at particularly high risk for type 2 diabetes. Over the past 30 years the prevalence of diabetes among Black/African Americans has quadrupled and Black/African Americans are 1.7 times as likely to develop diabetes as Whites.[9] One out of every two Black/African American children born after 2000 will have type 2 diabetes in their lifetime. Black/African Americans are not only more likely than Whites to develop diabetes but also experience greater disability from Diabetes-related complications such as amputations, adult blindness, kidney failure, and increased risk of heart disease and stroke; death rates for Blacks with diabetes are 27 percent higher than for whites.
A third type of Diabetes, gestational diabetes, develops in 2 to 5 percent of all pregnancies but usually disappears when a pregnancy is over. [1] Women who have gestational diabetes during pregnancy have a 7.5-fold increased risk for the development of type 2 diabetes.[10] Gestational diabetes occurs more frequently in Black/African Americans, Latinas, Native Americans, and people with a family history of diabetes than in other groups. Obesity is associated with higher risk.
Prediabetes, also referred to as impaired glucose tolerance or impaired fasting glucose, is a condition in which blood glucose levels are higher than normal but not high enough for a diagnosis of diabetes. People with prediabetes have a much higher risk of developing type 2 diabetes, as well as an increased risk for cardiovascular disease.[11] Without intervention efforts, up to 30 percent of people with prediabetes will develop type 2 diabetes within five years, and up to 70 percent will develop diabetes within their lifetime.[12] In California, more than 13 million adults (46 percent of all adults in the state) are estimated to have prediabetes or undiagnosed diabetes in addition to the approximate 2.5 million with diagnosed diabetes. Rates of prediabetes are disproportionately high among young adults of color, with more than one-third of Latino, Pacific Islander, Native American, Black/African-American, and multiracial Californians ages 18-39 estimated to have prediabetes.[13]
Type 2 Diabetes, which accounts for 90-95% of all diabetes, can be prevented or delayed through moderate weight loss, exercise and improved nutrition, yet, diabetes impacts health and health spending significantly.[14-15] Diabetes is the seventh leading cause of death in the United States.[1]It is a major contributor to cardiovascular disease, which is the leading cause of death, and is the leading cause of kidney failure and need for dialysis.[16-18] Diabetes can cause other serious health complications including blindness and lower-extremity amputations. And, while less than 2% of hospitalizations in California indicate diabetes as the primary diagnosis for hospitalization, more than 30% of all hospitalizations in California in 2011 among patients 35 and over had diabetes. [18] Diabetic Patients may require a higher level of care resulting in increased hospitalization costs; hospitalizations costs among diabetes patient hospitalizations in the 2011 California study were estimated to be $2,200 higher than among non-diabetic hospitalizations. [19-21]
Gestational diabetes may have long term health impacts for babies born to mothers with gestational diabetes. Many may suffer from excessive birth weight, preterm birth, respiratory distress syndrome, low blood sugar, and type 2 diabetes later in life.
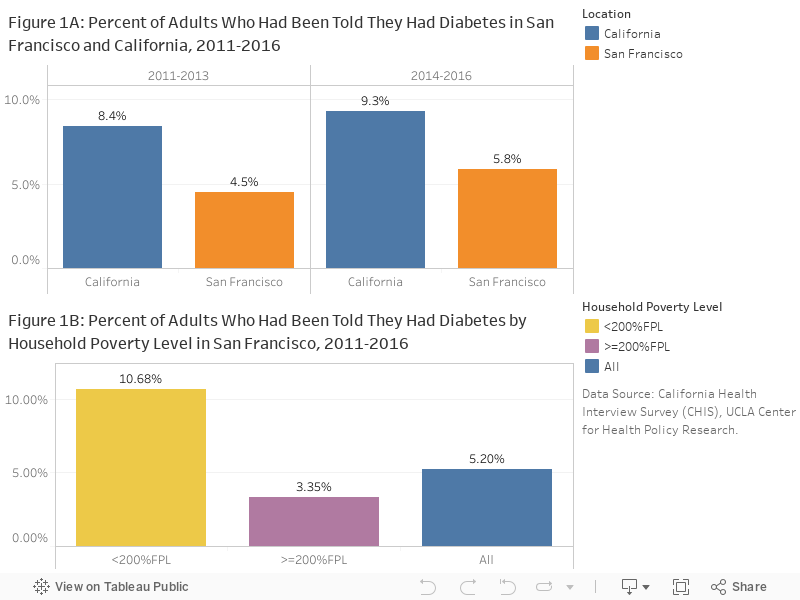
Diabetes Prevalence: An estimated 5.9% of San Franciscans had been told they had diabetes in 2014-2016, which increased from 4.5% in 2011-2013 but it was still lower than California state level 9.3% (Figure 1A). People living in households earning less than 200 percent of the Federal Poverty Level (FPL) were 3 times more likely to have diabetes than those who earn more (Figure 1B).
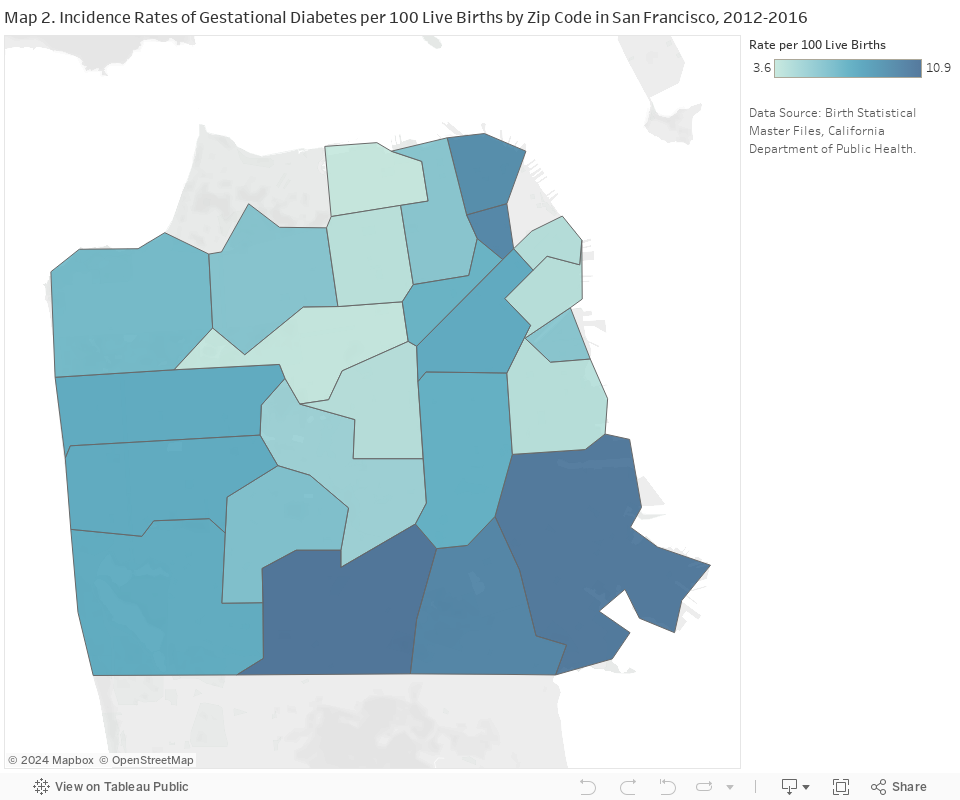
Gestational Diabetes: In San Francisco, the prevalence of gestational diabetes increased significantly from 5.4 (5.2-5.7) to 7.1 (6.9-7.4) percent of live births between 2007-2001 and 2012-2016. Residents living in the Sunset and Southeast neighborhoods of San Francisco were at highest risk of gestational diabetes (Map 2).
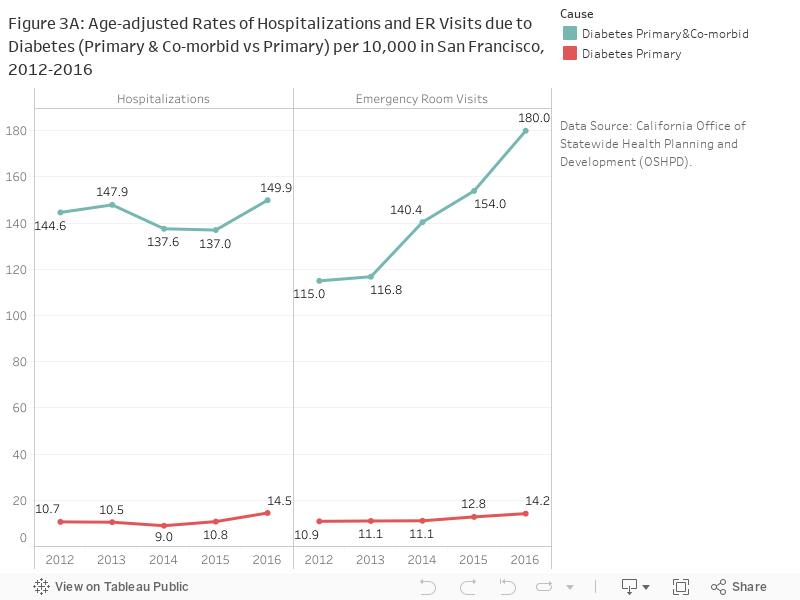
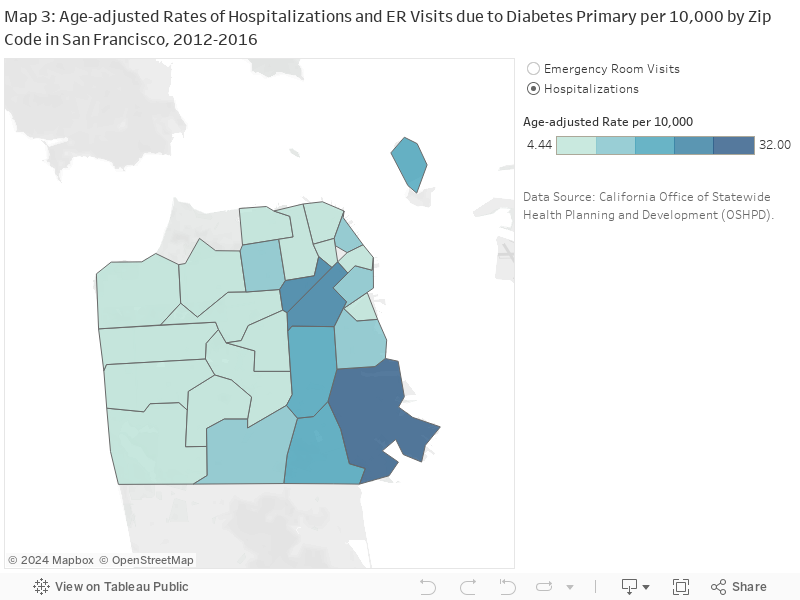
Hospitalizations: In 2016, the age-adjusted rates of hospitalizations and emergency room visits due to diabetes were 14.5 and 14.2 per 10,000 residents (Figure 3A). Research indicates that the true burden of diabetes may be substantially higher; analyses considering underlying causes of hospitalization instead of primary cause alone have found diabetes to be associated with up to a third of all hospitalizations in California. [18] The rates for diabetes as a primary or co-morbid cause were more than 10 times higher than as primary cause alone for both hospitalizations and emergency room visits (Figure 3A).
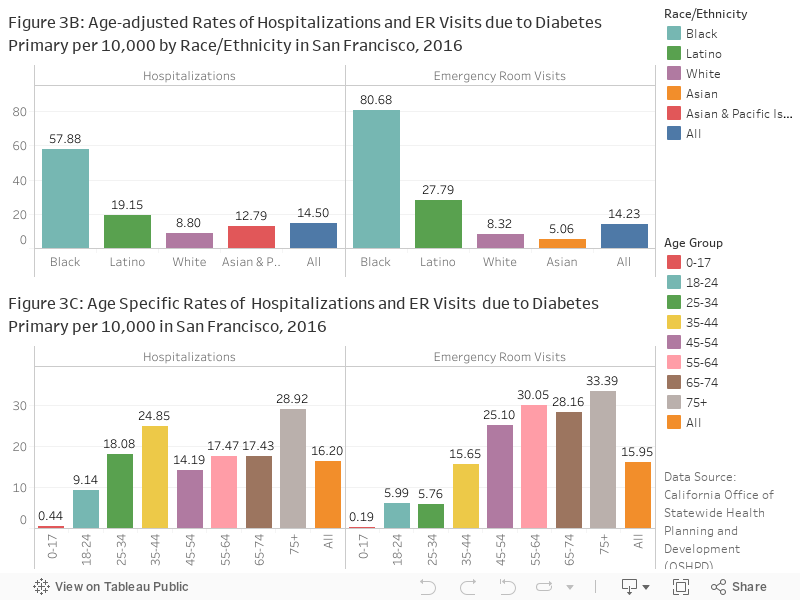
The rates in 2016 were significantly higher among Black/African Americans than all other races (Figure 3B). Hospitalization rate was also higher among residents in 35-44 age group besides the 75+ age group in 2016 (Figure 3C). Residents in the eastern zip codes (94102, 94110, 94115, 94124, and 94130) are more likely to be hospitalized or visit emergency room due to diabetes than those living elsewhere in San Francisco (Map 3).
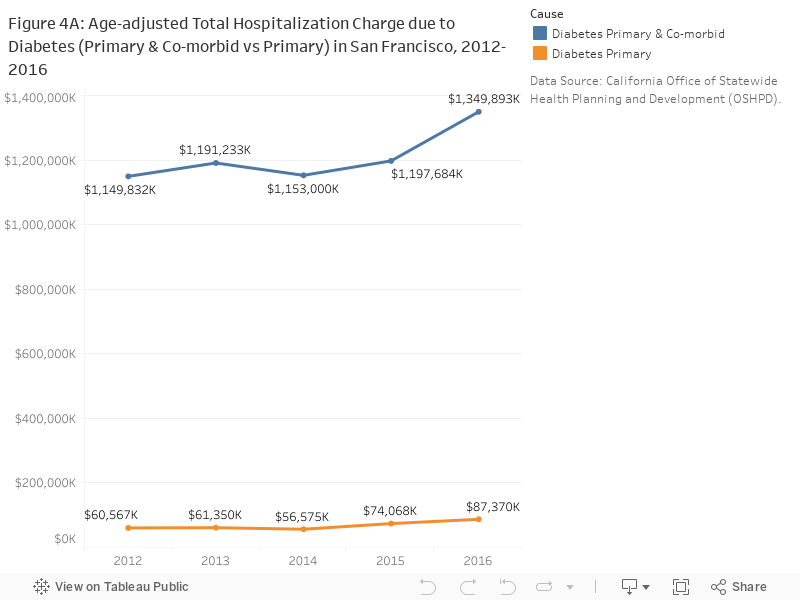
The total hospitalization charge due to diabetes as a primary cause in 2016 was $85,000,000 and the number was 15.8 times higher for diabetes as an underlying cause (Figure 4A).
CHIS California Health Interview Survey (CHIS), UCLA Center for Health Policy Research.
CDPH Birth Statistical Master File, California Department of Public Health (CDPH).
OSHPD California Office of Statewide Health Planning and Development (OSHPD).
Hospitalizations and Emergency Room Visits:
ICD-9 and ICD-10 codes for Diabetes were obtained from the PQI 93: Prevention Quality Diabetes Composite (September 2017) and PQI 16 : Lower-Extremity Amputation among Patients with Diabetes Rate (March 2015) technical specifications published by the Agency for Healthcare Research and Quality. A medical visit was determined to be primarily due to Diabetes if the primary diagnosis field contained on the the identified ICD-9-CM (discharges prior to October 2015) or ICD-10 (October 2015 and later) codes. To Identify visits where Diabetes was the primary cause, a co-morbidity, or coexisting with another primary cause, all 25 diagnosis fields were searched.
Population estimates for rates:
Standard population for age adjustment:
Hospitalization and ER rates measure the number of admissions or visits, not the number of residents who are hospitalized. Admissions records may include multiple admissions by the same person.
In October 2015, the diagnosis coding standard for Hospitalizations and Emergency Room visits was changed from ICD-9 to ICD-10. Caution should be used in comparing data using the two different standards.
Gestational diabetes: Information about diagnosis of gestational diabetes is obtained within 10 days of a live birth from chart review and/or in-person interview after delivery in hospital. Trends in gestational diabetes may reflect changes in definition, screening or referral protocol.
Statistical instability: Statistically unstable estimates are not shown in this document. Statistical instability may arise from:
Statistical instability indicates a lack of confidence in an estimates ability to accurately and reliably represent the population. Due to statistical instability, estimates are not available for all age, gender, ethnicity, or other groups.
[1] Centers for Disease Control and Prevention. Basics about diabetes. http://www.cdc.gov/diabetes/basics/diabetes.html, 2015. Accessed March 1, 2017.
[2] Elizabeth J Mayer-Davis, Jean M Lawrence, Dana Dabelea, Jasmin Divers, Scott Isom, Lawrence Dolan, Giuseppina Imperatore, Barbara Linder, Santica Marcovina, David J Pettitt, et al. Incidence trends of type 1 and type 2 diabetes among youths, 2002–2012. New England Journal of Medicine, 376(15):1419–1429, 2017.
[3] George Alberti, Paul Zimmet, Jonathan Shaw, Zachary Bloomgarden, Francine Kaufman, and Martin Silink. Type 2 diabetes in the young: the evolving epidemic. Diabetes care, 27(7):1798–1811, 2004.
[4] Sanjay Basu, Paula Yoffe, Nancy Hills, and Robert H Lustig. The relationship of sugar to population-level diabetes prevalence: an econometric analysis of repeated cross-sectional data. PloS one, 8(2):e57873, 2013.
[5] James A Levine. Poverty and obesity in the us, 2011.
[6] Centers for Disease Control, Prevention, et al. National diabetes statistic report, 2017. Atlanta, GA: Centers for Disease Control and Prevention, US Department of Health and Human Services, 2017.
[7] Elias K Spanakis and Sherita Hill Golden. Race/ethnic difference in diabetes and diabetic complications. Current diabetes reports, 13(6):814–823, 2013.
[8] Juliana CN Chan, Vasanti Malik, Weiping Jia, Takashi Kadowaki, Chittaranjan S Yajnik, Kun-Ho Yoon, and Frank B Hu. Diabetes in asia: epidemiology, risk factors, and pathophysiology. Jama, 301(20):2129–2140, 2009.
[9] Centers for Disease Control and Prevention. Diabetes. https://www.cdc.gov/media/presskits/aahd/diabetes.pdf, 2008. Accessed March1, 2017
[10] Rhonda Bentley-Lewis. Gestational diabetes mellitus: an opportunity of a lifetime. Lancet (London, England), 373:1738–1740, May 2009.
[11] Centers for Disease Control and Prevention. Prediabetes. https://www.cdc.gov/diabetes/basics/prediabetes.html, 2016. Accessed March 1, 2017.
[12] Adam G Tabák, Christian Herder, Wolfgang Rathmann, Eric J Brunner, and Mika Kivimäki. Prediabetes: a high-risk state for diabetes development. The Lancet, 379(9833):2279–2290, 2012.
[13] Susan H Babey, Joelle Wolstein, Allison L Diamant, and Harold Goldstein. Prediabetes in california: Nearly half of california adults on path to diabetes. Policy brief (UCLA Center for Health Policy Research), pages 1–8, March 2016.
[14] Vasanti S Malik and Frank B Hu. Sweeteners and risk of obesity and type 2 diabetes: The role of sugar-sweetened beverages. Current diabetes reports, January 2012.
[15] Centers for Disease Control and Prevention. Preventing diabetes. https://www.cdc.gov/diabetes/basics/prevention.html, 2016. Accessed March 1, 2017.
[16] Robert N Foley and Allan J Collins. End-stage renal disease in the united states: an update from the united states renal data system. Journal of the American Society of Nephrology : JASN, 18:2644–2648, October 2007.
[17] Centers for Disease Control and Prevention. Leading causes of death. http://www.cdc.gov/nchs/fastats/leading-causes-of-death.htm, 2016. Accessed March 1, 2017.[18]
[18] American Heart Association. Cardiovascular disease and diabetes. Website, 2015. Accessed March 1, 2017.
[19] Ying-Ying Meng, Melissa C Pickett, Susan H Babey, Anna C Davis, and Harold Goldstein. Diabetes tied to a third of california hospital stays, driving health care costs higher. Policy brief (UCLA Center for Health Policy Research), pages 1–7, May 2014. This policy brief was developed in collaboration with the California Center for Public Health Advocacy., Support for this policy brief was provided by a grant from The California Endowment to the California Center for Public Health Advocacy.
[20] M. Sue Kirkman, Vanessa Jones Briscoe, Nathaniel Clark, Hermes Florez, Linda B. Haas, Jeffrey B. Halter, Elbert S. Huang, Mary T. Korytkowski, Medha N. Munshi, Peggy Soule Odegard, Richard E. Pratley, and Carrie S. Swift. Diabetes in older adults. Diabetes Care, 35(12):2650–2664, 2012.
[21] Jeroen N Struijs, Caroline A Baan, Francois G Schellevis, Gert P Westert, and Geertrudis A M van den Bos. Comorbidity in patients with diabetes mellitus: impact on medical health care utilization. BMC health services research, 6:84, July 2006.